Guest Windows debugging and crashdumping under QEMU/KVM: Introduction

Hypervisor virtualization is a complex process, so problems such as BSoDs or hangs can occur when the guest operating system is running. These problems can be caused either by bugs on the guest side or by bugs in the hypervisor itself. There are two methods to analyze such problems on the guest OS side: debugging and dump analysis.
This post starts a series of posts dedicated to debugging and capturing dumps of Windows guests running under the QEMU/KVM hypervisor. In this introductory post, we will talk about debugging and crashdumping with the builtin Windows system software, and why this is sometimes not enough.
Kernel debugging
For kernel debugging you will need another Windows VM on which to run WinDbg. Kernel debugging can utilize several interfaces for connection between debugger and target: network (IPv4/IPv6), USB, serial, IEEE1394.
The simplest way in terms of setup is to use a serial connection.

To do this we need to add a serial port to each of the VMs.
Debugger VM:
-serial tcp::4445,server,nowait
Target VM:
-serial tcp:127.0.0.1:4445
The TCP port can be changed from 4445 to any unused port.
The following command should be executed on the target VM side to enable kernel debugging of the default boot entry:
bcdedit.exe /debug on
The following command enables serial debugging through the `COM1’ port at 115200 bit/s:
bcdedit.exe /dbgsettings serial debugport:1 baudrate:115200

The above changes will take effect at the next boot. Now everything is ready for debugging.
The following command runs kernel debugging in WinDbg through the `COM1’ port at 115200 bit/s:
windbg.exe -k com:baud=115200,port=com1
WinDbg will wait for a connection:

Now we can start target VM. The boot manager will tell us that debugging is turned on:

After some time WinDbg will tell us that connection is established:

At the same time the target machine works as usual. Now we can send a Break command:

The execution of the target machine will be interrupted and we will be able to enter WinDbg commands in the command line, such as k, lm n t and so on:

Memory dump on BSoD
In case of a kernel-mode error Windows can automatically save a dump on the disk. Specific behavior can be controlled in the “Startup and Recovery” menu:

By default, when failure occurs, Automatic Memory Dump is captured and saved to C:\Windows\MEMORY.DMP. The existing file is overwritten. Then the system reboots.

After that, if the crash dump were successfully retrieved from the disk, it can be opened in WinDbg for analysis:

The screenshot from WinDbg shows that Windows saved BugcheckCode (0xd1) and BugcheckParameters to help us understand what the problem is.
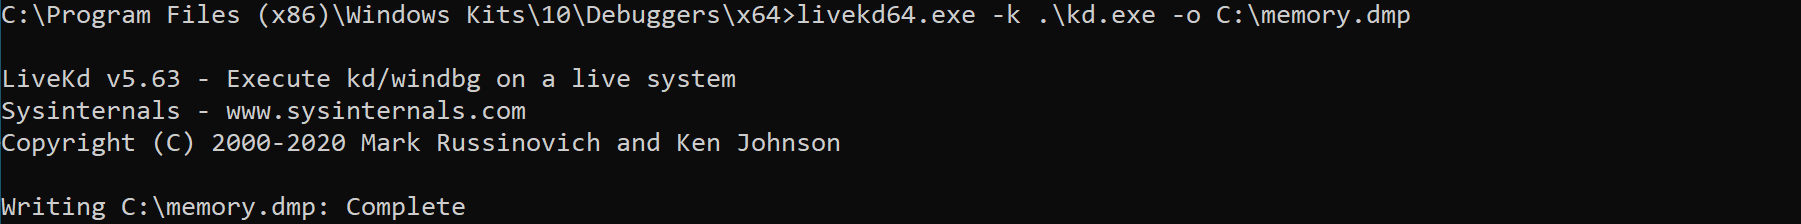
Memory dump from LiveKD
LiveKD from Sysinternals Suite can create Complete Memory Dump from a live system:
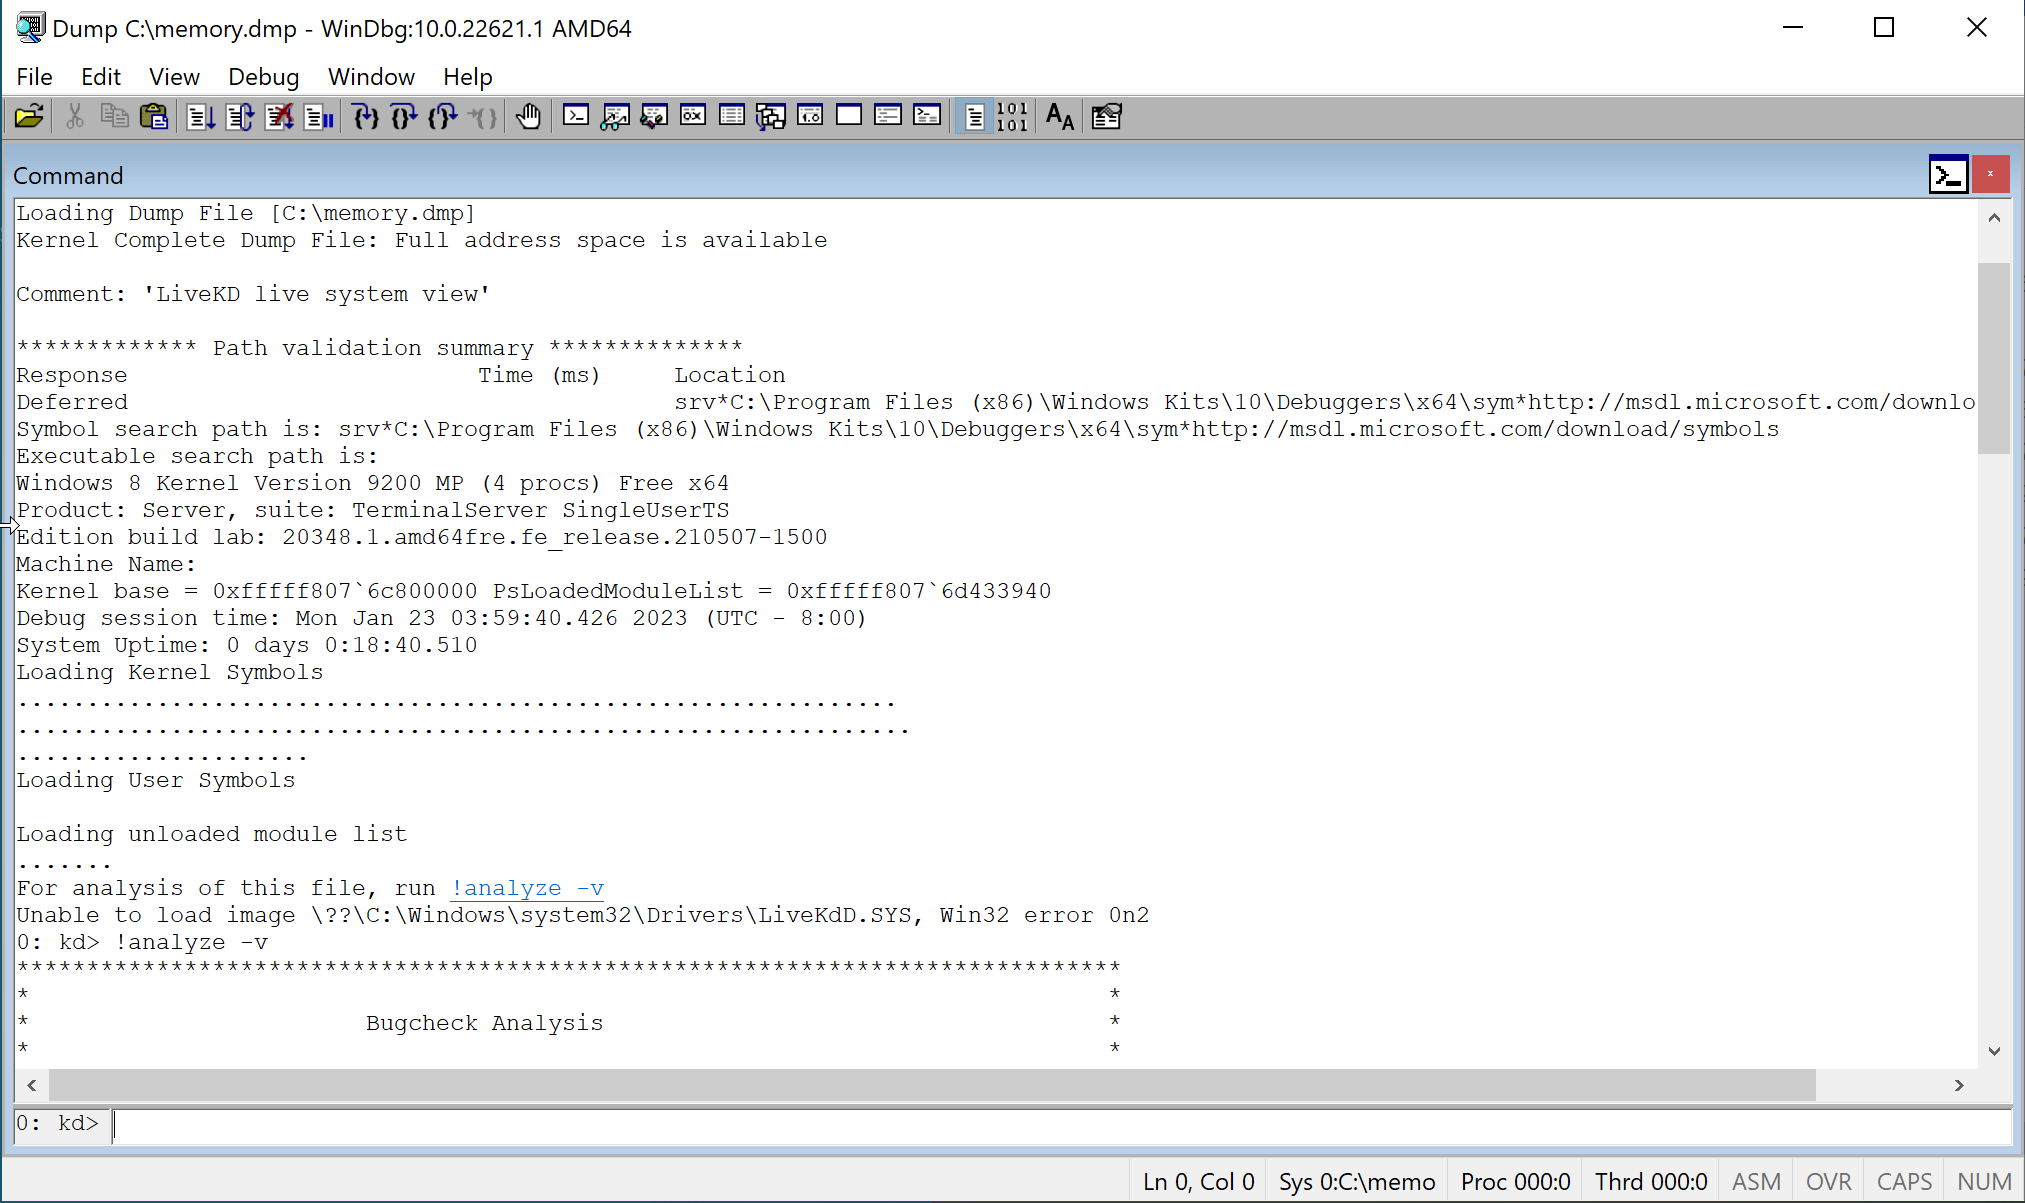
Such a dump can be opened in WinDbg as a crash dump:
Limitations
The main and perhaps the only problem with kernel debugging is that it must be configured and started before an error occurs. So, it is convenient for a development environment but it cannot be used on the customer server or during automatic testing. Memory dumps are much better suited for analyzing a problem that has already occurred, but the built-in methods of collecting them have some disadvantages.
First of all, the default settings are not very good. Automatic Memory Dump, captured by default, is similar to Kernel Memory Dump. It only includes memory allocated to the Windows kernel, HAL, kernel-mode drivers and other kernel-mode programs. So, the system must be specially configured by the user to create a Complete Memory Dump that most fully reflects the state of the system.
There are also situations where a dump cannot be created. For example, if there is not enough free space on the disk. Complete Memory Dump consumes as much space as the total physical memory. Also, sometimes the storage driver is the source of the problem.
Besides that, the built-in dump generation mechanism can’t help when a dump is needed in the moment of VM freeze or another point of interest unrelated to the crash.
Thus, it would be nice to have tools that allow us to get the most detailed dump of the guest Windows at any point in time on the hypervisor side, preferably without any preconfiguration. All these circumstances have led to development of more convenient ways of capturing dumps, which will be described in the following posts.